Why is Celery not running my task?
Introduction
We got a bug report the other day that was interesting. Some feature that was implemented with a Celery task was sometimes taking too long to execute. This feature is about executing a playbook in our Chat service when a new conversation starts. It asks guests a few questions in order to qualify them and help them getting information about our customer's businesses. This playbook normally runs inmediatelly after the person opens the chat widget to start a conversation but we were seing cases where it took more than 30 seconds to run! As most interesting bugs, this problem was happening randomly and we couldn't reproduce it.
So my friend Ben and I sit together trying to understand what was going on and we start digging in our monitoring and logging tools to get any useful information.
A very slow queue
First we saw that the Celery task was being called right when the conversation started which is correct. But it stayed on the queue for 30 seconds and then if finally got picked by a worker process and run. This worker took about 200 milliseconds to run the task. So clearly the problem was the 30 seconds that the task was waiting to be processed.
So why did the task stayed at the queue for 30 seconds?
One theory was that our system was maybe generating too many tasks and our workers were overloaded and we have a capacity problem. So we went to see our metrics and find out that during that time window our workers were executing an average of 2 tasks per minute! Definetely not overloaded, looks like we had a lazy set of workers.
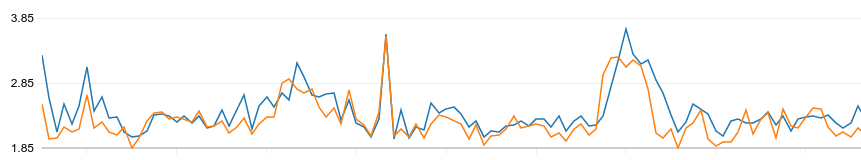
Each line in this graph represents the average number of tasks per minute each of our worker servers processes.
System architecture and Celery configuration params
Before we continue the investigation let me share how does our system architecture looks like. Nothing really special, just a very common Celery system.

And some details about our worker servers:

In summary:
- 2 Celery servers
- 1 worker per server with a concurrency of 3 processes + 1 master process.
- A default value for the worker_prefetch_multiplier setting of 4
So this mean we have 2 * 3 = 6 concurrent process that can run at the same time. Each server has a single CPU but most of our tasks are IO heavy.
A bit refresh of how prefetch works: the Celery master worker process will ask the broker for concurrency * prefetch_multiplier tasks at a time. In our case that is 3 * 4 = 12 task at a time. The broker may have less tasks at that particular moment but that's the maximum it will give to the worker. Once the worker has the 12 tasks it needs to distribute them to the 3 child processes via Linux pipes.
Difficult questions and non obvious answers
Back to the logs, we did some more queries thanks to the pretty good AWS Cloudwatch Logs Insights product to try to understand what were the workers doing during that time. This is when I confirmed my suspissions that our observability is not very good because it was not easy to answer this question. With a little bit of effort we confirmed the following facts:
- Our second worker server was not running any tasks
- In the first worker server a very slow task took 80 seconds to complete
- Right after the slow task was finished, the same worker child process started to run our playbook task
- During those 80 seconds other tasks were run in the same server by the other 2 worker child processes. Some of these tasks were called after our playbook task was called
Ok, at this point nothing made sense and we have some questions:
- Why was the second worker server idle when there was a task waiting to be run?
- Why some tasks finish before our playbook task even when they were being called after?
Celery simulation
In order to answer these questions I started reading everything I could about Celery in its documentation and also doing a lot of Google searches. Then I went to the Celery source code and start puting print statements and change some functions to see how that was affecting the behavior. At the end of this process I got a pretty good idea of what was going on. So I made a little simulation to explain it step by step.
Use the Previous and Next button under the picture to play it forwards or backwards.

Answers to the questions
Why the second worker server was not processing tasks while there was a task waiting?
Because each server fetches tasks from the queue in a Round Robin fashion, 12 tasks at a time (3 concurrent process * 4 tasks to prefetch). So when our playbook task showed up in the queue it was the turn of the first server to fetch tasks. For this decission it does not matter that the first server was still running a task while the second one was idle. In Celery, neither the broker or each worker know what the other workers are currently doing.
One way to minimize this problem is to reduce the value of the prefetch parameter. This makes sense if your producers are not generating a lot of tasks. This way the tasks are distributed in a more uniform way across your servers. On the otherside, if you generate a lot of tasks you want to prefetch a big number of tasks because the queue will always have tasks and you want to minimize the overhead of pull tasks from the queue.
Why there was a task waiting for the first child process when there were two other child processes idle?
Once a worker node fetches tasks from the queue it's up to it to decide how to distribute the task among its child proceses. By default Celery uses a policy called fast but it can be configured to use a different policy called fair.
The fast policy assign the tasks to the child process in order. So every time it fetches tasks from the queue it will start assigning them to child 1, then child 2, then child 3 and then back to child 1 and so on. It puts the task in the pipe that communicates the master process with the child process as long as there is space in the pipe. In Linux a regular pipe default size is 64 KB and it can be set up to 1 MB so a few tasks can easily fit in this buffer. This policy is good when there are a lot of small tasks in your workload.
The fair policy takes into account how busy each child proccess is and chooses the child with less tasks at that moment. This policy is good when there are big tasks in your workload. It is worth noting that Celery changed the default policy in version 4.0 and now they are using fair as their default. I forgot to mention that we are using Celery 3.
Takeaways
As discussed above there are several ways to solve our problem:
- Make our tasks smaller by splitting the big fat task into smaller tasks. Turns out we can easily do that in most of the cases. A very common antipattern in celery is having a for loop that iterates over a bunch of elements and do the same processing in each item. This is easy to split by having a parent task that just spawns children tasks where each child task perform the work for a specific item.
- Configure Celery to use the fair policy. This way we can prevent our problem of having a task waiting for a long time while there where available computing resources idle.
- Create multiple queues and send tasks to each of these queues based on their size. For example you may have a slow tasks queue and a fast tasks queue. This way your slow tasks won't block your fast tasks.
In the end we decided to go with the first solution and split our big task into smaller tasks. It has the unrelated benefit that it is also faster to restart a Celery worker. If you try to restart the worker and it is running a big task it will wait until the task is finish. This is bad for our deployments.
We are also monitoring how long each task takes and creating structured logs for the slow tasks. Base on this we can setup automatic alerts that tell us if we have slow tasks. This is a topic worth to explore in a separate post.
As usual using high level systems that do something useful for you is very handy but sooner or later you will find issues that requires you to understand how these abstractions work under the hood. Don't be afraid to dig deep and understand all these details. It is time very well spent.